 Magezon Blog Help Merchants Build Comprehensive eCommerce Websites
Measuring key performance indicators (KPIs) to your company’s health can never be underestimated. They allow you to comprehensively understand your company’s performance and enable essential modifications to your execution to meet particular strategic objectives.
Keeping track of the right eCommerce KPIs can help you make better decisions about your business. Conversion rate, site traffic, net promoter score, and shopping cart abandonment rate are some of the essential eCommerce KPIs to consider. Your decision will be based on your unique strategy and goals.
Although, there is no such thing as a “one-size-fits-all” solution. However, most internet firms may benefit from a few key performance metrics.
Learn more about “what KPIs stand for,” “what are eCommerce KPIs,” what are goals and KPIs for an eCommerce website, and the top eCommerce KPIs to track every online store has to measure to meet specific strategic goals in this article.
Table of contents
What Does KPI Stand for?
What does KPI stand for? KPI stands for Key performance indicators.

And what are KPIs for eCommerce websites? Key performance indicators (KPIs) for eCommerce are key indicators that can assist you in figuring out why your eCommerce firm is succeeding or failing. These metrics measure how successfully an online business owner, team, or organization meets its objectives and goals.
Online company owners can make better-informed choices about conversions and revenue, marketing, customer happiness, and operations by tracking the proper eCommerce KPIs.
Why Is KPI Important to the E-commerce Business?
If you own an online store, you probably want to boost your conversion rate and income while giving your consumers a pleasant shopping experience.
However, suppose you don’t have precise KPI goals and KPIs for an eCommerce website. For instance, your organization’s sales, marketing, customer service, shipping, and other aspects. In that case, it might be challenging to reach. That’s why KPIs are incredibly vital for your online shop.
Here are six reasons why you should set eCommerce KPIs to track your business:
- Keep an eye on your company’s health: KPIs measure a company’s health. To keep track of your company’s vital signs, you need a few KPIs. Moreover, only measure what you want to move so you can focus your energy on where it will have the most impact. Regarding this problem, we’ve discovered that measuring a few KPIs in each of the four categories is critical: employees, customers, processes, and revenue. So, ensure you find the right KPIs for your company, then consider who will be responsible for them.
- Assist you in determining growth: KPIs give a quick view of your company’s overall performance. In other words, you’ll better know your business when you hold yourself accountable by monitoring objectives and targets using KPIs.
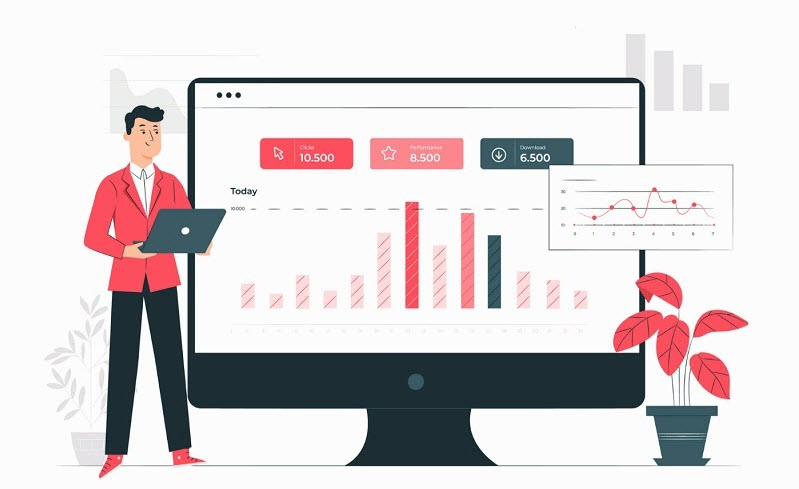
- Give you lots of data-driven insights: As a business owner, data is constantly at the forefront of your decisions. Above all, data-driven insights can assist you in making educated decisions based on real-time data that visualize the following steps to enhance your online shop.
- Boost your internet sales: Many KPIs will be related to tracking and increasing sales. Choosing KPIs like conversion rate, customer retention rate, average order value, and customer lifetime value to track if you’re generating online sales will help you take action to impact visitor and customer behavior.
- Enhance employee and consumer interactions: An effective KPI system will encourage and reward staff while ensuring that they know its objectives. Employees will work toward customer service KPIs and better help consumers once they have a better grasp of this.
- Continue to make modifications as needed to stay on track: Using a mix of KPIs provides you with the information you need to address problems and take advantage of opportunities. If you’re experiencing a sales slump, select a few KPIs to help you turn things around, for instance.
In conclusion, KPIs are more than simply statistics you send out once a week. They help you analyze the performance and health of your company so you can make important modifications to your execution to meet your strategic objectives. Knowing and monitoring the appropriate KPIs can assist you in achieving faster outcomes.
How to Choose the Best Ecommerce KPIs for Your Business
When it comes to KPIs, one of the most common errors small businesses make is measuring everything. However, if you measure everything, you won’t be able to determine what’s “important.” And this may soon become overwhelming. All this data is available through Google Analytics, eCommerce KPIs and other systems, but you only need to look at key insights to assess your success.
So, how to choose eCommerce web analytics KPIs? The simple answer is that it is dependent on several variables. While there is no one-size-fits-all approach to selecting the correct KPIs, there are a few factors you should always keep in mind. Here are some of the most effective strategies to ensure that you choose the proper KPIs for your organization and that you use them correctly:
1. Choose the Right KPIs by Considering the User, Business, and Product Goals
Firstly, you must be clear on the target audience and business objectives before choosing the top key performance indicators or KPIs. If your product generates income directly, revenue is likely to be crucial. If you’re unsure what these objectives are, consider how the product helps both the users and the business. For instance, why would individuals want to use it, and why would a company want to put money into it.
Use any product goals you’ve defined for your product to generate additional KPIs and round out your collection of indicators. The advantages or results that your product should provide are known as product objectives. These objectives should be drawn from, or at the very least, in a more practical line with, the user and company objectives.
2. Make Your KPI Goals Specific

What are eCommerce KPI goals? Knowing your product’s business goals is essential for choosing the correct KPIs. However, this is insufficient. The plans must be precise and practical to successfully apply the indicators, analyze the resultant data, and take the appropriate measures. Setting such objectives might be difficult, especially for new or young products. So, the following suggestions can assist you in this regard.
3. Use Ratios and Ranges to Your Advantage
It would be helpful if you defined your objectives using ratios and ranges. So, instead of applying precise figures to announce a product’s performance, you should use ratios and ranges to make the goal more inclusive. For example, product A should increase the company’s sales by 7 to 10% within a year after its launch. In their book “Lean Analytics,” Alistair Croll and Benjamin Yoskovitz suggest this strategy.
While you can’t ensure that your goal will be met, you can keep track of your progress. If the goal proves to be too high, you may adjust the target by shifting the line.
4. Avoid Vanity Metrics
Vanity metrics make your product look attractive but add no value. So, avoid using them. For example, the number of downloads for an app. While many users may download the product, this says little about its success. In other words, instead of counting downloads, you should track something more practical, like daily active usage or referral rate.
5. Don’t Try to Quantify Everything That Can Be Quantified
Don’t measure everything that can be measured, and don’t put your faith in an analytics tool to collect the correct information. Instead, use the business objectives to choose a limited number of KPIs for eCommerce stores that will assist you in understanding how your product works. Otherwise, you risk spending time and effort analyzing data that yields few or no conclusions. In the worst-case scenario, you act on irrelevant information and make poor judgments.
6. Quantitative and Qualitative KPIs Should Always Be Used
Quantitative indicators, such as daily active users or income, assess the quantity of something rather than its quality, as its name implies. They offer the advantage of gathering “hard” data that is statistically representative. User feedback, for example, is a qualitative indication that can help you understand why something happened. Such as why consumers aren’t as happy with the product as they should be. Combining the two categories offers a more balanced view of your product’s performance. Moreover, it lowers the danger of losing sight of the essential success factor: the people who buy and use the product.
7. Make Use of Both Lagging and Leading Indicators.
Revenue, profit, and cost are lagging indicators that look backward and tell you about the results of previous activities. Conversely, leading indicators might assist you in figuring out how probable your product is to achieve a target in the future. Take, for example, product quality. Adding new features will be less cost-effective and time-consuming if the code becomes more complicated.
As a result, meeting profit objectives and delivery deadlines will become more complex. However, you can identify if you’ve accomplished your company goals using backward and forward-focused indicators and predict if the product will fulfill them in the future using forward-focused arrows.
8. Consider Indicators Other Than Financial and Customer
The two most common indicator types are economic indicators, such as revenue and profit, and customer metrics, such as engagement and referral rate. While these indicators are critical, they are not sufficient. For example, assume your product meets its revenue and profit targets and has a high customer engagement and referral rate.
This indicates that your product is performing well and that you have nothing to be concerned about. However, suppose team motivation is low or code quality is deteriorating simultaneously. In that case, you should be worried: These indicators suggest that achieving product success will be much more difficult. As a result, you should look beyond financial and customer indicators and consider the product, process, and people indicators.
9. Trends in Leverage

You should compare the information you provide against statistics from other periods, user groups, or rivals. Such as sales growth over the previous six weeks or cancellation rates from quarter to quarter. This aids in identifying patterns, such as whether revenue is rising, flattening, or falling. Trends help you comprehend what’s going on and take the appropriate action.
If a decrease in the venue is a one-time event, there is generally no need to be concerned. If it’s a trend, though, you should look into ways to reverse it – unless you’re going to retire your product.
10. Make Use of a Scorecard for Products
You should gather relevant data and analyze it regularly once you’ve chosen the proper key performance indicators for your product. This is when a product scorecard comes in handy. A good scorecard employs the appropriate needles and aids in detecting trends.
In addition to financial and consumer indicators, these product scorecard key performance indicators templates provide a comprehensive view of product performance by displaying product, process, and people KPIs. You can download the template from here.
Types of Key Performance Indicators
What are the best KPIs for eCommerce? For eCommerce firms, there are several financial KPIs to select from. Here are five that might give you a good idea of where you are in the middle of the year:
- Marketing
- Sale
- Customer service
- Manufacturing
- Project management
Top eCommerce KPIs to Track, for Example
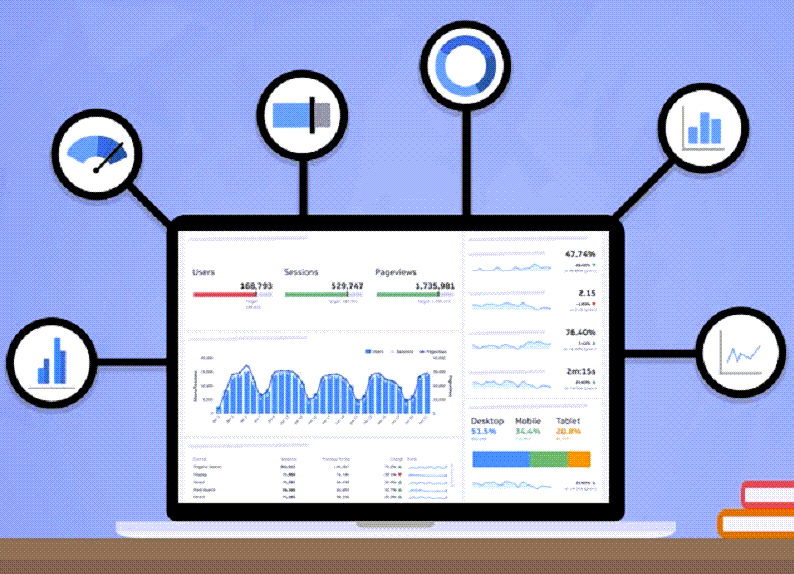
Knowing how your employees and products function is critical to business decisions. And that knowledge comes from monitoring the appropriate website key performance indicators (KPIs). But how can you decide which key performance indicators are optimal for your firm when there are hundreds to pick from?
That is why we have compiled this list. We collected some top eCommerce KPIs to track, ranging from sales to customer service to marketing. Choose KPIs relevant to your sector, and you’ll be ready to assess your eCommerce company’s performance.
Key Performance Indicators to Measure Marketing

You won’t know if your marketing efforts are paying off unless you track campaign performance. Use KPIs to explain your initiatives and, if necessary, make changes. Here are some of the most important KPIs for eCommerce to measure Marketing.
1. Traffic
One of eCommerce’s most crucial marketing KPIs an eCommerce site owner would want to monitor is website traffic. The more traffic your site receives, the greater your chances of converting those visitors into paying customers.
Not only does traffic lead to purchases, but it also raises brand recognition. The more people who come to your site, the more likely they will remember your name, recommend you to their friends, or return when they need to buy anything from you. As a result, one of the most common — and crucial — website KPIs to measure is traffic.
Traffic is an important weekly KPI for eCommerce. As a result, keep an eye on your eCommerce site’s traffic regularly for big spikes or drops and any other strange trends. Whether you’re tracking traffic using Google Analytics, look at your referrals to determine if another website or social media network brings you many visitors.
2. New vs. Returning Visitors
New site visitors are those who are visiting your website for the first time. Returning visitors, on the other hand, have already visited your website. While this statistic does not disclose much, it can assist eCommerce merchants in determining the performance of digital marketing initiatives. Returning visitors should be more significant if you’re running a retargeted ad, for example.
On the other hand, retaining a client is five times less expensive than gaining a new one. As a result, having a client retention strategy in place makes sense. This KPI will help you determine whether or not your efforts are practical. It might also aid in assessing customer service and the quality of your customer connections.
3. Time on the Website & the Website’s Average Session
Time on site displays the amount of time visitors spend on your website. More incredible time spent implies they’ve engaged with your brand more deeply. More time spent on blog material and landing pages, and less time spent on the checkout process, is usually what you want to see.

And the average session is the average time a visitor spends on your website.
Avg. Sessions = Total session duration/Total number of session
Average page views and time on site will reveal how well your content engages visitors and whether you generate good traffic. If this KPI monitoring shows low numbers, the issue might be with your target keywords, which means you’re attracting unqualified visitors. Another issue might be the speed of your site; online buyers are impatient, and if your site is sluggish, customers may abandon it.
4. Pageviews/Visits
The average number of website pages a visitor views during each visit is called page views per visit. This KPI measures your e-commerce site’s efficiency (product catalog, categories, product pages, search options, etc.) and capacity to engage visitors.
As a result, more pages generally mean more significant interaction. However, you should reconsider your site design if customers have to make too many clicks to discover the desired goods.
Pageviews per Session = Total number of pageviews/ Total number of visitors
5. Bounce Rate
These basic eCommerce marketing KPIs shows how many people abandon your website after just looking at one page. Of course, this number should be kept as low as feasible.
Bounce Rate = Total number of page visits/ Total number of entries to a website
The bounce rate of your website is the percentage of visitors. Those visitors depart after coming from a referral source such as a search engine or another website. Although this KPI applies to everyone who visits your site but does not make a purchase, a high bounce rate might suggest that most visitors aren’t finding what they’re looking for. As a result, bounce rate has become a crucial KPI for every business’s website.
Read more: How To Reduce Bounce Rate For Your Website in 2021
6. Traffic Sources
“The data on the growing and shrinking traffic sources are exciting because it not only helps us identify new trends in consumer behavior but also helps us identify where marketing dollars should be spent.”, Yotpo’s Content and Social Marketing Manager, Justin Bullion.
What are the demographics of your target market? What about Google, Facebook, and email? Which networks bring in the most money? The traffic KPIs source shows you where and where your visitors come from. This will indicate which techniques bring in the most traffic, such as organic search, paid ads, or social media. This information will assist you in determining which channels to concentrate your marketing efforts on.
7. Site Traffic on Mobile Devices

It shows how many visitors arrive at your site using mobile devices. Because Google prioritizes mobile-friendly and optimized sites, the success of the portable version is just as critical as the performance of effective marketing or ad campaigns. Tracking traffic lets you determine how well users interact with your site’s handsets version. If the desktop traffic indication is substantially more significant than the smartphone traffic indicator, your mobile website is either not optimized or requires substantial upgrades.
Because so many people buy on their smartphones and tablets, mobile optimization is critical for eCommerce. Keep track of how many people reach your business via mobile devices, and make sure your site is mobile-friendly.
8. Social Media Engagement
The number of followers or fans you have on Facebook, Instagram, Twitter, Pinterest, TikTok, or Snapchat (or a mix of these platforms) is a helpful KPI to evaluate consumer loyalty and brand recognition.
Ecommerce firms may use several social media networks’ capabilities to discover more about their followers. The amount of time your followers and fans spend connecting with your business on social media is called social media engagement.
To clarify, the number of times your business is mentioned on social media is a reliable measure of how your social media initiatives affect overall brand awareness. The theory is that the more your brand is mentioned on social media, the higher your brand’s awareness will be, as assessed by Brand Recall.
9. Product Review Quantity and Quality
Reviews are the driving force behind your business and are top KPIs for eCommerce platforms. They assist you in preserving your brand’s reputation and remaining competitive in the marketplace.

Users will begin to trust your organization after reading previous customer evaluations, resulting in increased product sales. In addition, they have a massive impact on a product’s and company’s performance. 80% of buyers admit that internet reviews have influenced their decision to buy a product or service, for instance.
To sum up, product reviews are beneficial for various reasons: they provide social proof, aid SEO, and provide helpful input for your company. Therefore, product review number and substance are crucial KPIs for any eCommerce firm.
10. Other Key Metrics
- Click rate: The total number of times a link has been clicked. This KPI may be tracked nearly anywhere: your website, social media, email, display advertisements, PPC, etc.
- Average click-through rate (CTR): The average CTR is the percentage of users that click on a link on a page (or asset).
Average CTR = Total number of clicks that an ad receives/ Total number of impressions
- Volume of pay-per-click (PPC) traffic: Every time someone clicks on one of your advertisements, it displays how much money you’ve spent. This eCommerce KPI may be used for search engines and social media advertising efforts. PPC, also known as CPC (Cost-Per-Click) (CPC), is one of the most often tracked eCommerce KPIs.
eCommerce PPC KPIs = Total advertising cost/ Total number of ads clicked
- Affiliate success rates: If you’re doing affiliate marketing, this KPI might assist you in figuring out which channels are the most profitable.
- Daypart monitoring: Observing when users arrive on your site might help determine the busiest times.
- Average position: This KPI provides information on your website’s search engine optimization (SEO) and paid search performance. This shows where you are on the page of search engine results. The majority of online merchants strive to rank first for their selected keywords.
- Unsubscribes: You may look at both the total number and the rate of subscriptions for your channel, your website, or your email list,
- Email Open: These eCommerce email KPIs show the percentage of subscribers who open your email. If your email open rate is low, try experimenting with different subject lines or cleansing your inactive or irrelevant subscribers list.
- Blog traffic: Create a filtered view in your analytics application to find this KPI for blog traffic. Comparing blog traffic to overall site traffic is also beneficial.
Key Performance Indicators to Measure Sale
What are the KPIs of eCommerce sales? Ecommerce sales KPIs are measurements showing how well your company is doing in conversions and revenue. To help you make better business decisions, look at sales KPIs for a specific channel, period, team, or employee. Here is the list of KPIs for purchase.
11. Average Order Value (AOV)
The AOV tells you how much your consumers spend on a single order. It is also known as the Average Market Basket.
AOV = Total revenue/ Number of orders
AOV indicates how much your customers are willing to pay for a single purchase and provides a more profound knowledge of purchasing behavior. It also allows you to adapt your sales approach. To improve conversions and deal with high CAC, you should try to increase this figure.
To clarify, offer a free delivery threshold, such as when you purchase above £50, to encourage a greater AOV. In addition, fashion merchants frequently utilize cross-selling to increase AOV. Customers are encouraged to purchase the shoes and accessories displayed on a website showcasing a dress, for example, by ASOS.
12. Gross Profit

Gross profit is a crucial eCommerce KPI that allows business owners to plan. The proportion of your genuine profit, or actual income, is represented by your gross profit margin. Keep in mind that profit is not the same as revenue. Profit is determined by deducting entire costs from total income or sales.
Therefore, the gross profit margin indicates how much your company makes and how healthy it is.
The eCommerce KPIs formula below may be used to compute the gross profit margin percentage.
Gross Profit = Total Cost of Goods Sold – Total Number of sales
13. Conversion Rate
The conversion rate (CV), also expressed as a percentage, is the percentage of people who convert on your eCommerce site (or buying). On the other hand, CV is one of the most important eCommerce KPIs. It shows your site’s success among visitors and how many users convert into leads or purchase from your company. Overall, you will better understand how your website is functioning.
Your team should track several sorts of conversions to obtain a thorough understanding of the company’s development. New visitor CVR, interactions per visit, traffic source, conversions by device type, and so on, for instance.
The total number of visits (to a site, page, category, or set of pages) is divided by the total number of conversions to arrive at this figure.

Conversion Rate = (Total number of visitors on the website/ Total number of conversions)x100
14. Shopping Cart Abandon Rate (CAR)
The shopping cart abandonment rate indicates how many users add items to their shopping cart but do not complete the transaction. In 2018, over 69 percent of customers abandoned shopping carts for various reasons. A lengthy checkout procedure, forceful upselling during transactions, and finding a lower price on a competitor’s site are examples. Only 7.5 percent of customers who exited the online store returned to complete their purchases.
This low figure emphasizes the necessity of keeping an eye on this metric. A high rate is a red flag that you should engage in and improve the checkout process. This value should be as low as possible.
CAR = (Total number of completed transactions/ Total number of shopping carts)x 100
15. Cost of Goods Sold (COGS)
The cost of goods sold (COGS) measures how much it costs to sell a product. This is the entire amount you spend to create a product or service. Manufacturing, distribution, salesforce, staff pay, and inventory costs.
As a result, your partners, analysts, sales force, and management will better understand the company’s bottom line by analyzing COGS.
What method do you use to calculate COGS?
COGS = Beginning Inventory Costs + Additional Inventory Costs – Ending Inventory
16. Customer Lifetime Value (CLV)

The CLV indicates how much a client is worth to your company over their engagement with you. In this section, you can find out how much money a single consumer may bring you. By determining CLV, you may discover the most profitable buyer segments and focus your marketing efforts on them. They are women/men, young/middle-aged/older, low/high income, local/international consumers, car/sport/healthy lifestyle enthusiasts, and so on.
After that, you’ll acquire loyal clients that bring in more money because they’ve been buying for a long time. The higher the CLV, the more frequent clients you have.
To boost this number, strengthen relationships by concentrating on client loyalty. In addition, it will assist you in determining your acquisition cost.
CLV = (Customer’s Annual Profit Contribution x Average Number of Years as Customer) – the Initial Cost of Customer Acquisition
17. Churn Rate
The churn rate is the percentage of consumers who have ceased utilizing your company’s services, canceled their accounts, or unsubscribed from your emails. The lower the brand’s turnover rate, the more successful it is. Your sales will suffer if you have a high churn rate. That’s why it’s essential to talk to your customers honestly and find out what irritates them and their problems with your company. Will it be long shipment times, lousy performance, poor customer service, poor website responsiveness, navigation, or entirely?

Your client’s lifetime value will be higher if this rate is lower. By keeping an eye on your churn rate, you can verify that your products are well-suited to your target demographic.
To sum up, to reduce churn, you should use a web analytics system that offers purchase scenario models based on distinct buyer characteristics, such as the RFM model.
18. Customer Acquisition Costs (CAC)
CAC indicates how much you’ll have to spend on average to bring on a new customer. The cost of customer acquisition statistics allows you to assess the effectiveness of your marketing efforts and the return on your acquisition expenses. Calculate the client acquisition cost per channel to discover your top-performing tracks (where you should be putting your cash).
You’re calculating the cost of gaining a new customer. If you know this indication, you may build a well-designed plan to “buy” your consumers based on the number of necessary clients and estimated marketing expenditure.
CAC = Costs spent on acquiring customers/ Number of customers acquired
19. Repeat Purchase Rate (RPR)

The repeat purchase rate indicates the percentage of your whole client base that makes repeat purchases.
Firstly, simply divide the total number of consumers who have purchased on several occasions by the total number of customers to get the repeat purchase rate KPI. 0
Secondly, segment your visitors to see who has only purchased once or twice and who purchased several times.
Finally, use this data to fine-tune your targeting and personalize your marketing messaging to these various audiences.
RPR = Purchases from repeat customers/ Total purchase
For example, with your most devoted clients, you may adopt a more personalized approach (by considering their purchase history to craft highly relevant messages).
20. Other Key Metrics
- RPV – Revenue per visitor measures how much a person spends on your website in a single visit. If this KPI is low, you may use website analytics to determine how to increase online sales.
- RPC – Revenue per click is the average income generated by each click across all of your PPC ads. It assigns a monetary value to each paid click.
RPC = Revenue/ Total number of clicks
- Purchase Frequency: It calculates the average number of orders placed by your clients over a certain period. This is an excellent KPI for determining consumer loyalty and highlighting underperforming goods or categories.
Purchase Frequency = Total number of orders/ Total number of unique customers
- Time Betweens Purchase: It indicates how long a consumer waits before making another purchase from you. As a result, it’s a vital eCommerce KPI to understand since it helps you to adapt your campaigns to their preferences.
Time between Purchases = Purchase Frequency/ 365
- Affinity for the product: This KPI shows you which goods are frequently bought together. Cross-promotion tactics may and should be informed by this.
- Inventory levels: This KPI may tell you how much inventory you have on hand. How long has it been sitting? And how rapidly it is selling, and so on.
- Relationship between products: This is the order in which goods are seen. So you can use this KPI to develop effective cross-selling strategies once more.
- Competitive pricing: Measuring your success and growth against yourself and your competitors is critical. Compare and contrast your pricing methods with those of your competitors.
Key Performance Indicators to Measure Customer Service

KPIs for Customer Service enable your support team to track customer happiness, ongoing dialogues, and more to measure and improve customer service. Here is the list of KPIs to track for Customer Service.
21. Customer Satisfaction Score (CSAT)
Customer replies to your surveys may be used to track this important eCommerce KPI. “How satisfied are you with your experience?” for instance. A numerical range ranging from 1 to 5/10 is generally used to answer this question.
CSAT = Sum of all scores/ Total number of respondents
Above all, this measure may be calculated by delivering a survey to a client shortly after a purchase or support engagement. Customers assess your business on a scale of “Not at all satisfied” to “Very satisfied.”

The customer’s experience when interacting with your website determines the responses.
For example, if consumers are required to fill out too much information, they will likely express dissatisfaction. And customers are less likely to be happy with you if they have to wait in line before being connected to a customer service agent.
22. Net Promoter Score (NPS)
The net promoter score (NPS) is a critical statistic that measures the percentage of consumers who will suggest your company to their friends, family, or coworkers. This KPI provides insight into your customer connections by indicating how likely customers are to recommend your brand to a friend or family member.
It’s assessed by a customer survey that asks, “How likely are you to suggest “ABC Corp” to your friends?” Your customers will rate your business on a scale of 0 to 10.
Customers that have a higher NPS are happier with your entire brand. Likewise, if your NPS score is poor, you must take the necessary steps to enhance it. Friendships are always trusted more than advertising.
Consequently, if your consumers are unwilling to suggest your brand, you must work hard for every dime. But, if your consumers are satisfied with your services, they will recommend you to others. And they’ll become your most influential brand ambassadors.
23. Customer Effort Score (CES)

CES measures how much effort your consumers put in to complete a job. It also demonstrates how quick and painless your clients’ experience is. For example, if your client has a question, how quickly it can be answered or what they must do to get it answered will be measured. If you want your clients’ shopping experience to be as seamless as possible, don’t ask them to fill out too much information or direct them to many pages.
Firstly, you can measure it with a simple customer survey asking, “How much effort did you have to put in to resolve the issue?” Secondly, on a scale of “Very Low Effort” to “Very High Effort,” your clients will rank you. You may also say, “ABC helped me locate the exact product I was looking for.” Finally, your customers can respond by rating on a scale of “Strongly Disagree” to “Strongly Agree.”
24. Average Time to Resolve a Complaint
This eCommerce KPI measures how long your customer service team takes to handle a customer issue. It starts when the client first contacts you with a problem. These eCommerce KPIs ensure that your customer care department responds quickly.
This measure can directly influence your customer satisfaction (CSAT) score. It also indicates the efficiency of your staff because customers don’t like to wait long to get their issues handled. However, focusing only on resolution time isn’t always a smart strategy. Most importantly, you must go further into the causes of the figures.
Avg. Complaint Resolution Time = (Number of Customer Service Requests – Total Number of Unresolved Request) / Total Number of Requests Received
25. First Response Time
The average eCommerce KPIs for the first response time is the average time it takes for clients to obtain the first response to their inquiry. Many service level agreements (SLAs) include a baseline FRT, which indicates that firms must react to consumers within a specific duration.

Your average first response time is symbiotic with customer satisfaction (CSAT). Customers dislike waiting in lines to get their problems handled. “We’ve found that timeliness and speed directly correlate with satisfaction. A first response perceived as fast can set you on the right track for a positive first impression.”, Luis Hernandez, VP of Customer Success at Geckoboard.
26. Conversion per Teammate
Conversations Per Teammate keeps track of how many client interactions each support team member has. That is to say, this is frequently monitored daily (i.e., Conversations Per Teammate Per Day).
“At Intercom, we track the number of conversations each teammate handles (more traditional customer support operations would call them cases). It’s a great way of showing when and where the team is being overworked and needs backup.”, said Jeff Gardner, Director of Customer Support, Intercom.
27. Concern Classification

Look at quantitative data surrounding patterns to determine if you can be proactive and decrease customer support questions and the overall number of customer support contacts. You’ll categorize client complaints, which can aid in identifying trends and tracking your progress in resolving issues.
Firstly, simply categorize the most common difficulties your customers have, such as signup troubles, cancellation issues, and feature not loading, to generate this measure. Then, count all the tickets you receive per problem over time, such as a day, week, month, or quarter, to get a better idea of the primary consumer pain points.
28. Rate of Service Escalation
The rate of service escalation KPI indicates how often a client has requested a supervisor or senior employee from a customer care agent. You want to maintain this number as low as possible.
The first teammate to react may not be able to resolve all concerns. Tickets requiring in-depth topic knowledge are frequently escalated to coworkers with excellent expertise.
On the other hand, a rising Escalation Rate may suggest a persistent issue with your product or service. Also, the routes to an agent with the necessary topic expertise are not well-defined. It might indicate that your support staff requires extra assistance or training.
29. Backlog
Unresolved customer support requests in a given time frame are referred to as a backlog. Because of team member performance, ticket volume, dependencies, and complexity needing more time, some issues remain unresolved beyond the standard response period (for your organization).

“Backlog is critical because every open case indicates a customer is waiting to be served, and each case has a ‘holding cost.’” – Marci Reynolds, ACI Worldwide’s EVP of Service Delivery and Customer Experience.
Keeping track of your ticket backlog is a good method to see how efficient your customer service procedure and team are. Do you have a large enough team? Do you need a self-service support center to deal with common problems? Is your staff in need of further training or technical expertise?
30. Hit Rate
The hit rate provides a high-level picture of your customer care team’s workload. To clarify, you can notice trends in volume and predict when you’re most likely to have a rise in tickets or chats if you follow one of these measures as a trend.
These broad perspectives are crucial for two reasons. For starters, you’ll be able to manage your staffing demands and predict when to hire more people. Second, you will receive an early warning indication if something is broken. For example, if you see an unexpected increase in tickets, it’s possible that a feature isn’t working or that the marketing team sent the wrong link in a campaign email.
Divide the total sales of a particular product by the number of customers who have contacted your customer care team about that product to get your hit rate.
Key Performance Indicators to Measure Manufacturing
A manufacturing Key Performance Indicator (KPI) or metric is a well-defined and measurable indicator that the industry employs to track its progress over time.
Ecommerce firms, in particular, use KPIs, especially retail eCommerce KPIs, to track, evaluate, and improve operations, frequently comparing their efficiency to that of rivals in the same industry. Here are some of the most important KPIs for Ecommerce to measure manufacturing.
31. Cycle Time
Although the cycle time KPI is basic, it may be modified to become a highly effective tool. Cycle time is the average time it takes to create a product in the manufacturing business. The cycle time metric may determine how long it takes to create a finished product and each component.
It may even go so far as to incorporate end-user delivery. As a result, the cycle time may be utilized to assess a manufacturing process’s overall efficiency on a macroscale and identify inefficiencies on a micro-scale.
Cycle time = Process End Time – Process Start Time
32. Forecasting Demand
Companies use this production measure to predict the number of raw materials they need to satisfy future consumer demand. However, companies may find it more difficult to properly utilize this measure since it mainly depends on unpredictable external variables.
The following is the fundamental formula:
Projected Customer Demand = Raw Materials x Production Rate
33. Inventory Turns

This metric indicates resource performance by determining how often inventory is sold during a specific period. Low ratios imply low sales and surplus inventory, whereas high ratios show solid and inadequate inventory.
Inventory Turns = Cost of goods sold/ Avg. Inventory
34. Time It Takes From Cash to Cash
This is a manufacturing KPI indicator that is dependent on time. It calculates the time it takes for a firm to collect cash from its customers for raw materials, inventory, or a manufacturing facility after an initial cash outlay for raw materials, stock, or a manufacturing plant. This KPI is usually expressed in days.
Time it takes from cash to cash = Inventory Sale Date – Inventory Purchase Date
35. Costs Saved
This does not imply that you can skip paying your debts and pocket your money. The manufacturing avoided cost measure is a calculation of how much money you saved by spending money. Isn’t that strange? The most typical example is machine maintenance cost against the repair cost if a machine breaks down, plus the lost production value due to the repair downtime.
36. Takt Time
When scheduling production orders or choosing whether or not to accept a client’s order, this is a highly helpful manufacturing KPI.
The greatest amount of time spent creating a product while still fulfilling a client’s deadline is known as takt time. Takt is short for “taktzeit,” a German term for “cycle time.” This is not to be confused with the cycle time KPI, which is quite similar.
Takt Time = Net available time/ Customer’s daily demand
37. First-Time Yield
First Time Yield (FTY), also known as First Pass Yield (FPY). It’s an eCommerce KPI that measures how wasteful your manufacturing process is. FTY is one of the most critical production KPIs in manufacturing. It determines the percentage of items manufactured to specification the first time around. This implies they don’t need to be reworked or thrown away. A greater FPY rate is very desirable for every company.
38. Manufacturing Cost Per Unit
You must understand the overall cost of manufacturing a product per unit. You wouldn’t be able to price a thing without it appropriately. This KPI considers all manufacturing expenses and divides them by the number of units produced. Materials, overhead, depreciation, labor, and other expenditures are common.
39. Maintenance Cost Per Unit
Maintenance costs are generally considered an expense item; therefore, this production measure is frequently neglected. It is, nevertheless, a crucial lean manufacturing KPI to consider when attempting to maximize efficiency.
Thus, the entire maintenance cost (including preventative and emergency) is divided by the units produced during a certain time in this computation.
40. Overtime Rate

This statistic compares the number of overtime employees work to the number of standard hours they work. Thus, it aids in the detection of scheduling and personnel inefficiencies. For example, a rapid increase in overtime hours might indicate a transient increase in order volume or economic development.
On the other hand, they can demonstrate employee devotion and faults in work procedures, such as an understaffed team dealing with tremendous pressure.
41. Rate Of Absences
It’s a crucial KPI since it shows how motivated and engaged a person is at work and in the organization. Workers with poor motivation and engagement have been found in previous studies to be more prone to call in ill or miss a few days of work.
Certainly, it is critical to track and minimize this statistic over time since it will surely influence your business. The corporate atmosphere or overall productivity will threaten your money and general well-being.
42. On-Time Delivery

On-time Delivery isn’t really a production performance indicator. But they are still one of the most crucial KPIs & top KPIs for eCommerce platforms in the manufacturing industry. To clarify, clients will not want to deal with you if you can’t deliver on time, even if you have the most efficient production line in the world. Moreover, some luxury brands always have the most fastidious customer. So you should put “on-time delivery” into luxury retail eCommerce KPIs to track.
This indicator represents the percentage of items delivered to clients on time. For example, set a weekly target of 99% on-time performance and consider awarding your staff if they meet it. This one is aided by several of the other leading indications listed. How much of your entire product is delivered on time?
Key Performance Indicators to Measure Project Manager
Top eCommerce KPIs to track project management are used to assess how well a project performs. Without KPIs, determining project success or failure would be arbitrary and based on guessing. Even if one could, one could not quantify how well or poorly the initiative has performed. That’s why we should have KPIs to measure Project Manager
43. Working Time
The number of hours provides crucial information about how much time your team devotes to each project. As a result, to anticipate and resource future projects with simplicity, your managers must analyze the difference between projected vs. actual worked hours.

Firstly, understanding whether activities took longer or shorter can aid in effectively allocating consultation and training time. Secondly, knowing which teams must go above and beyond may help develop a relevant incentive. Consequently, this reward program brings better time management planning.
44. Planned Budget
The amount of money you set aside for your project is your budget. Management of operational costs of products (excluding sales and marketing) is a crucial KPI for project managers where margins are a critical corporate aim. As a result, a capable project manager would search for new ways to cut expenses in other areas when faced with a budget constraint.
Knowing how, where, and why a project’s budget varies is critical for identifying waste and inefficiency and better preparing for the unanticipated problems that most projects include.
45. Milestones Missed as a Percentage
Throughout the project lifecycle’s five phases, projects change. Therefore, maintaining project momentum necessitates identifying milestones and completing objectives. For instance, employees may become frustrated if too many milestones are missed or altered. So, identifying when milestones are missed can aid in the restart of a project and avoid future problems.
46. Variation in Cost
Examining your total cost versus your expected cost is the focus of these standard KPIs. It enables you to choose where you should save money and where you should invest more.
Keeping precise cost variance statistics can give you a thorough picture of which teams and procedures are the most efficient. Similarly, it can assist organizations in determining whether a project is worthwhile, and managers select whether to pursue similar ventures.
47. Return On Investment (ROI)
This eCommerce KPI shows how much your hard work has paid off in your online business. All of your spending and earnings are accounted for in this KPI. Simply said, the greater this number is, the better.
ROI calculations determine a project’s financial worth with its cost. Will the project generate a profit for the corporation or the client? What is its financial worth or potential? Are there other projects or investments that would provide a better return on investment? To sum up, this KPI is frequently used to determine whether or not to start a project or compare the two initiatives’ worth.
48. Cost Performance Index
The cost performance index (CPI) is a metric for determining a project’s financial efficacy and efficiency. It represents the amount of work accomplished per unit of expenditure.
The CPI, like the ROI, tells you the worth of your resource investment. Similarly, it compares the budgeted cost of the work you’ve accomplished to the actual amount spent. This ratio measures the expense efficiency of a project—earned value divided by actual costs.
It is determined as a ratio dividing the budgeted cost of finished work or earned value by the actual work cost.
CPI = Earned value/ Actual costs
49. Planned Value vs. Project

The KPI calculates how much of your money has been spent vs. what is still available. You can combine it with other projects’ KPIs to compare the schedule to the budget.
If you have a $20K budget and only have 30% of the project completed, the remaining work is expected to cost $6,000, for instance, i. Use this project KPI to compare actual costs to the budget and make adjustments.
Planned Value (PV) = % of the scheduled project remaining x Budget
50. Risk Matrix
Risk management isn’t just for risk and compliance departments anymore. Over the previous few decades, it has evolved into a company-wide responsibility. Consequently, risk matrices are commonly used to assess the difficulty of the Ecommerce firm.
The Risk Heatmap, often known as the 5X5 Risk Matrix, is a well-known method of evaluating a project’s risk profile or performance. A risk heat map visualizes project hazards on a 5X5 matrix, with risk probability and impact expressed in the rows and columns. Thus, a project manager or portfolio manager can rapidly grasp the risk profile based on the number of risks in a particular region.

51. KPIs for Project Change Requests
Changes in projects are an unavoidable component of executing “project business.” There isn’t a single project that runs exactly as planned without any modifications. Consequently, change requests can be both beneficial and detrimental to a project. Change management is the process of determining if a change request is correct or incorrect.
But, it is impossible to approve or reject change proposals without appropriate measures for evaluating benefits and impacts. The only way to get there is to have project change request KPIs.
Conclusion
There are numerous performance indicators, each of which has a value proportional to the aim being measured. For example, monitoring which pages a customer visits before calling customer service makes sense as a KPI for customer service since it might assist in uncovering areas of misunderstanding that, if resolved, would minimize customer service calls. However, for Marketing, the same performance indicator would be worthless.
It’s critical to regularly monitor and update your KPIs once you’ve set your business goals and KPIs. In addition, it’s critical to have data from all essential eCommerce KPIs in a single spreadsheet if you want to manage a data-driven eCommerce business.
As an entrepreneur, you must assess your marketing performance under one umbrella and determine which areas require additional attention. Your performance should influence your company decisions, and you should use the KPIs mentioned above to guide your actions.